
Recently I had the occasion to do a bit of viewshed analysis in QGIS. I have done these before using tools in ArcGIS, but this was the first time I had the pleasure of doing this kind of analysis in QGIS. I was impressed by the simplicity and flexibility of the toolset.
The views from our office at Stirling are fairly legendary, with Stirling Castle, much of the Ochil Hills and the Wallace Monument all visible from our windows. But how to quantify this – what can we see from our office? This is what a viewshed does – using a height model and a position on the map it will tell you what you can (theoretically) see.
As a starting point, we can use the Ordnance Survey’s 50m Digital Elevation Model: Terrain 50.
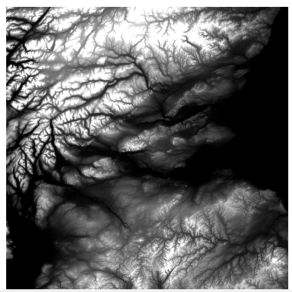
So now we have the heights of all the hills and glens of central Scotland represented in a raster.
The function we are going to use is the Grass r.viewshed function which, rather conveniently, does most of the heavy mathematical lifting for you.
The R.Viewshed function is a GRASS function which integrates nicely into QGIS allowing you to use the algorithm without delving into the GRASS interfaces.
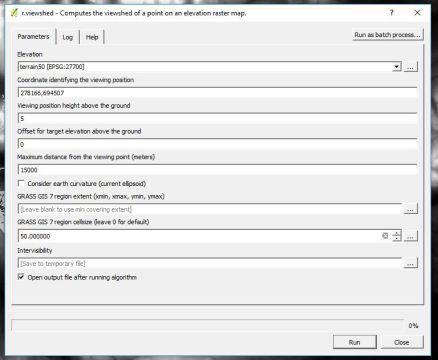
So here we are using the Elevation Model called Terrain 50, the coordinates identifying the viewing position (thinkWhere’s office in Stirling).
We are on the first floor and without measuring the height of the building and our average employee standing up, we have estimated the height of the viewing point at 5m.
The viewshed analysis allows you to set up a height to offset the target elevations as well. This would be very useful for an analysis of windfarm visibility or for a radio mast.
A good way to think about it is like this:
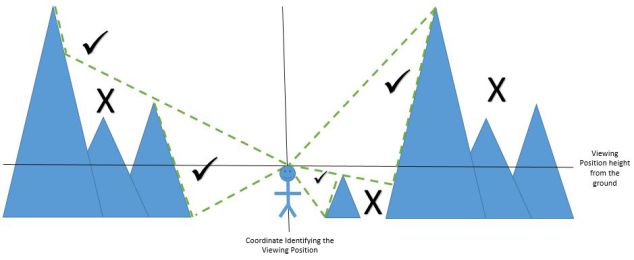
In this example, the viewer is looking to see what part of the landscape they can see. The height of the person is the viewing position and there is no height offset for heights on the landscape.
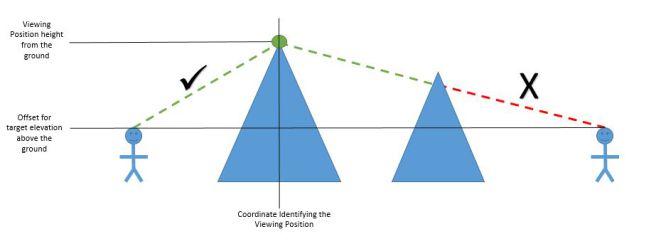
In this example, the viewing position is on the top of a hill and looking out at objects of a defined height.
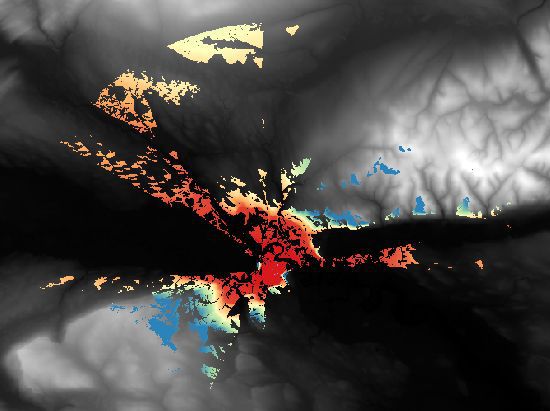
So we can run this algorithm in QGIS to compute the theoretical view from our office.
The output looks a bit like this. Now it needs a little bit of processing to get it to something a bit more meaningful.
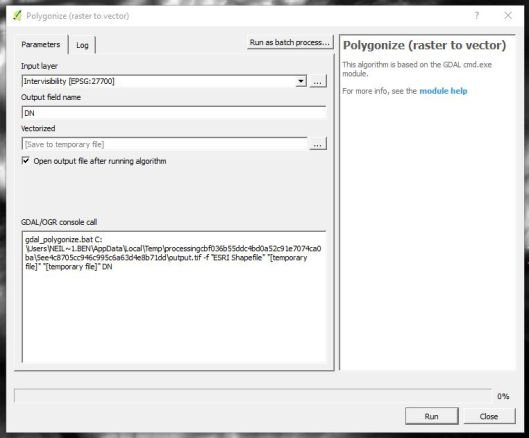
First of all, we’ll make this a vector for better symbology options. We can use the GDAL “Polygonize” function for this. The way that QGIS integrates these different applications into one place makes life so much easier for the GIS analyst.
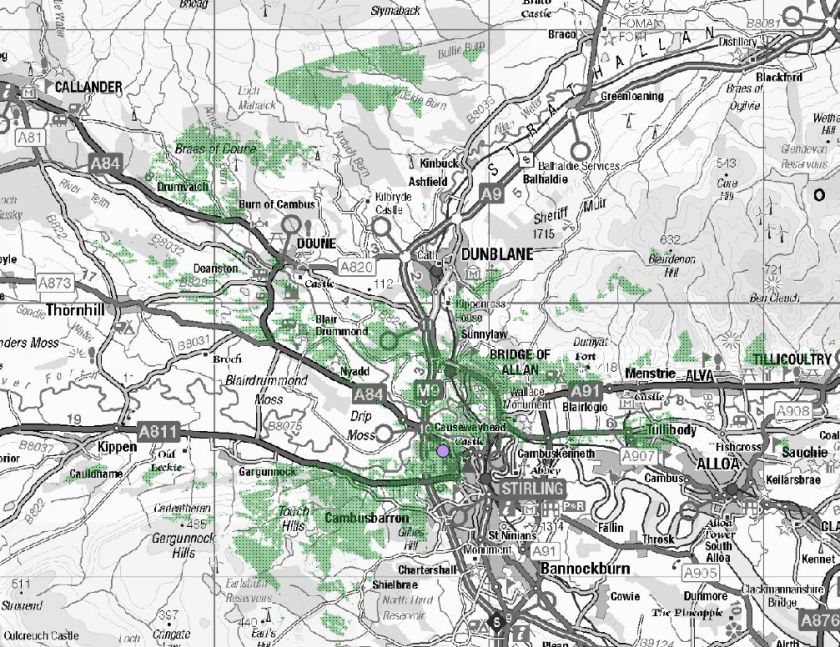
Bringing the QGIS symbologies into play, we can show the viewshed like this:
However, we can have more fun than that.
Projecting a hillshade on to the Digital Elevation Model and bringing in some Ordnance Survey Vector data allows us to produce something far more meaningful.
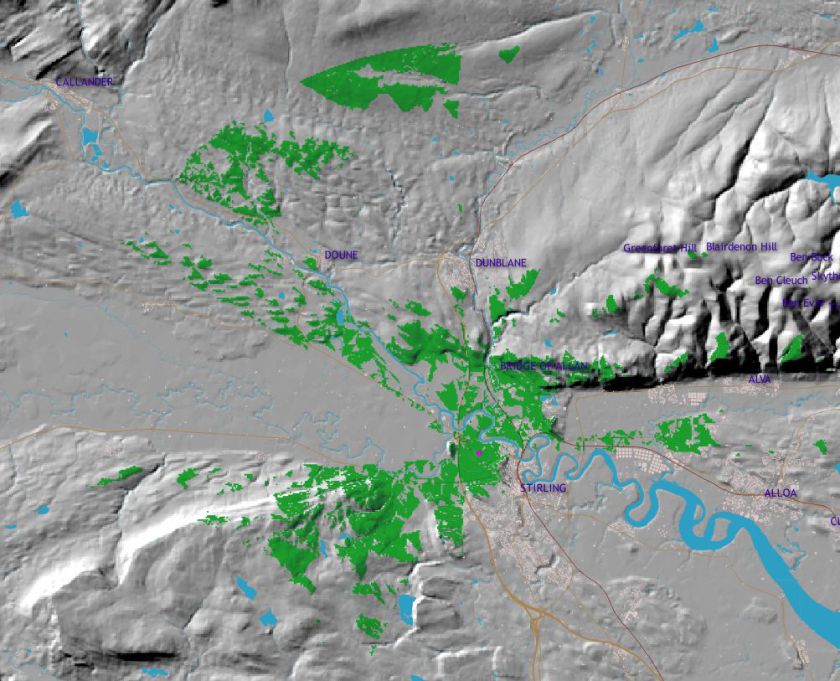
Using the hillshade analysis (that is the way to create the really funky 3d effect on the landscape) and bringing in some of the Vector Map District from the Ordnance Survey you can bring this map alive. Using only a very small amount of the data and concentrating on the physical features a viewshed analysis can be easily understood.
Using the blend mode stops the viewshed from obscuring the underlying data in the hillshade raster, making the information easy to understand. A few labels from the VMD names dataset helps give a little bit of context.
Viewsheds are very heavily used in renewables, telecommunication, and planning. QGIS, along with Ordnance Survey Open Data allows this to be done by anyone with access to a computer.